The Regional view displays the properties in the portfolio for a specific region. All you need to do is zoom in to the region. This view is displayed between zoom levels of 11 and 15. As you zoom in, the bins on the map are replaced by dots in different colors on the map.
Applying filters to view specific properties
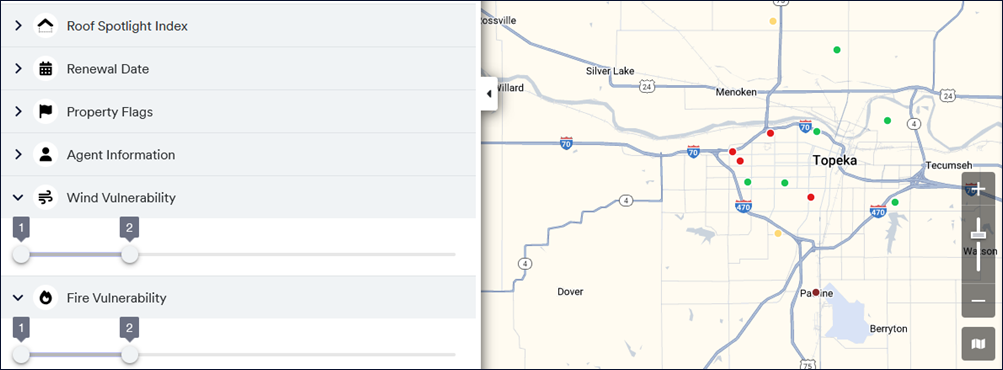
You can analyze your portfolio data further by using the filters to narrow down your data by:
- Roof Spotlight Index(RSI) score
- Renewal Date
- Property Flags
- Agent Information
- Vulnerability score for catastrophic events
You can choose one or more filters at a time. The selected filters are displayed at the top of the pane. Click Remove all to clear the filters.

You can use the arrow on the left to expand or collapse the sections.
RSI score
The RSI section displays an RSI bar with colors that represent the RSI score of the property, which is the lowest RSI score of any building at the property.

Select the tab for the required score. Use the slider to filter the number of properties by the score as shown below. The map is updated based on the range selected on the slider.

Renewal Date
Use the Renewal Date dropdown to select the month or the duration in which the policy for the properties are due for renewal. You can use this in conjunction with the RSI/Vulnerability score to decide whether a policy should be renewed. The map is updated based on the selected value.

Property Flags
Use the Property Flags dropdown to select flags that are present on a particular property profile. You can select more than one flag at a time by clicking the dropdown and selecting the required flag. The map is updated based on the selected value.

Agent Information
Use the Agent Information dropdown to select the properties that are insured by the selected agencies. You can select more than one agency at a time by clicking the dropdown and selecting the required agent. You can also type the name of the agent or agent code to search for the agency. The map is updated based on the selected value.

Vulnerability scores
You can view properties by their vulnerability to wind, wildfire, hurricane and hail. Use the slider to narrow down to view properties based on the selected vulnerability score. For example, properties that are at risk from wildfires or hurricanes (poor vulnerability scores for these events).
Export property data
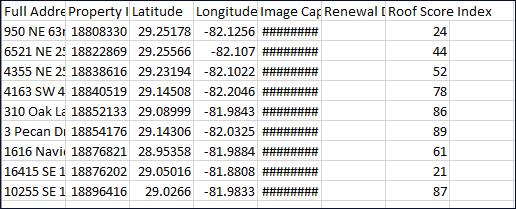
Click the Export icon in the left panel to export the list of property addresses based on the predefined filters for the Regional view. The data is stored in a CSV file with the naming convention shown below.

You can open this file in Microsoft Excel.