As an administrator, you can check the usage of Nearmap data through MyAccount. How you are charged depends on your subscription.
The details in this article apply to the accounts that are on the Current subscription model. If you are unsure about your subscription model, review this article.
Nearmap Usage Types
Your consumption of Nearmap data is displayed by Usage Type. The table below shows the different usage types that are in use and displayed in MyAccount.
Usage Type | Nearmap Product Consumption | Billed by |
|---|
2D export | 2D (Vertical, Oblique, Panorama) via MapBrowser or APIs | MB/GB, as applicable |
Area Export (3D export) | 3D via MapBrowser | sq km or sq mi |
Property Insights Credits | Nearmap APIs | Number of unique properties for which Property Insights are accessed. One credit allows you to access a single property and get consumed when you request AI Property Insights. |
API Daily Rate | Nearmap APIs | Number of daily API requests |
Credits | Content Types – Vertical, Panorama, DSM, True Ortho, DEM/DTM and Roof Condition Assessment via the Transactional Content API | Number of surveys accessed – single or multiple |
Property Credits | Nearmap APIs and Betterview | Number of unique properties accessed. One credit allows you to access a single property in the Portfolio Intelligence platform. |
NOTE: ArcGIS Online relates only to 2D Data. Usage is only shown in the annual and monthly charts alongside 2D Data.
Viewing usage for a subscription
The Account, Usage tab shows you a summary of your account, including your usage period, your annual data allowance, the duration you have remaining on your subscription, and the amount of data/number of transactions/API requests consumed on your account so far since the beginning of the annual subscription.
Usage is shown per subscription.
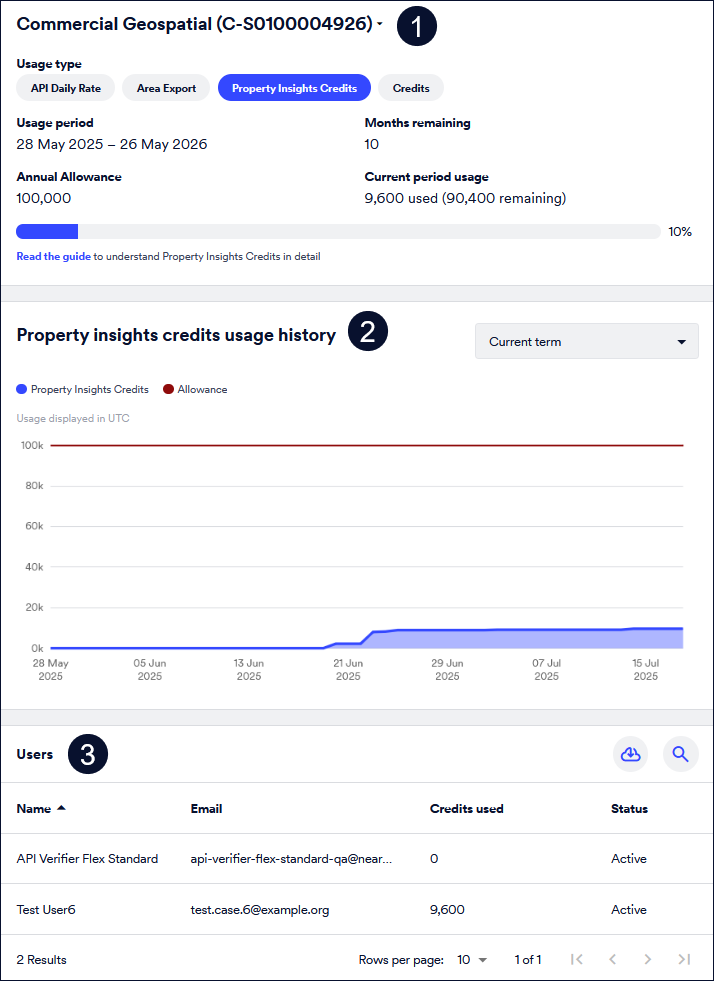
The Usage tab comprises three sections:
- Subscription: Displays the details of your subscription including the usage types for products on your subscription, the remaining duration of your subscription, usage period and current period usage.
If your account has more than one subscription, use the arrow next to the subscription name to select the subscription you want to view. If your subscription has more than one usage type, click the required Usage type you want to view. Refer to the table in the Nearmap Usage Types section above. - Usage History Chart: Displays the usage history chart based on the selected usage type.
- Usage Data: Displays usage data that corresponds to the selected usage type.
Viewing usage history
As an administrator you can view the Usage History chart to track usage. The type of chart displayed depends on the selected usage type.
The Usage history chart shows your usage for a selected period:
- Last 12 months
- Current term: If this is an annual subscription, selecting this option includes the data consumption from the beginning of the usage term until now
- Selected month: You can view usage charts that show historical usage on your subscription for each month in the past 12 months. Where you have a linked subscription with ArcGIS Online, you'll see both types of usage.
Where you have a linked account with ArcGIS Online, you'll see both types of usage. If viewing on desktop, you can hover your cursor over each bar to view the actual usage stats for the usage type and ArcGIS Online usage, if applicable.
For more information, see the following articles: