What is export area usage tracking?
Export Area tracking allows you to track unique 2D or 3D area exported via MapBrowser. You can track area exported in sq km or sq mi, depending on your location.
In Australia, the minimum purchasable area is 100 sq km, while in the United States it is 50 sq mi. The maximum purchasable area is 230,000 sq km in Australia and 232,000 sq mi in the United States.
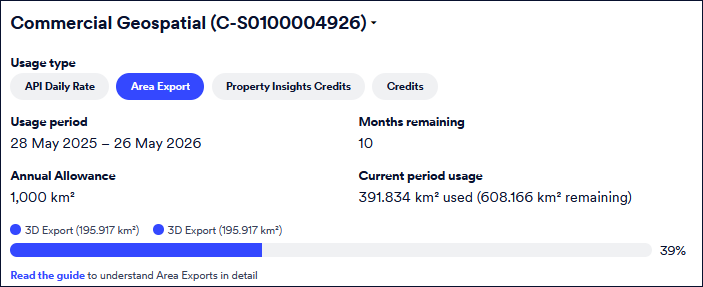
Only unique export area is recorded against your consumption, meaning you may re-export the same area multiple times during your subscription term without it consuming from your Export Area allowance.
Viewing usage history
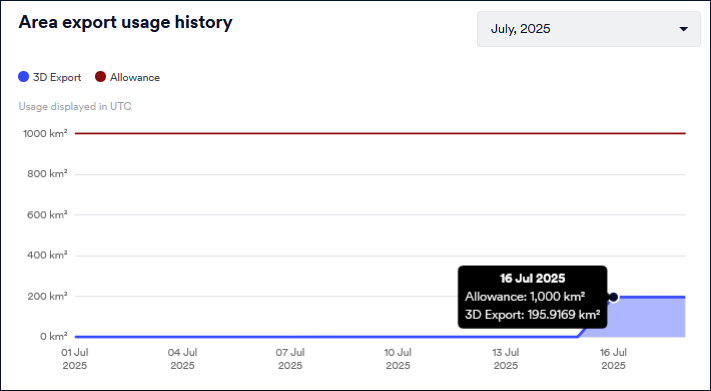
Select the duration for which you want to view export area usage history. The usage chart shows you the annual export area allowance, and the amount of data in sq km/sq mi consumed since the beginning of the annual subscription.
Also see, View Your Account Data Usage.
Viewing usage by user
Below the chart, the Usage by user table shows you a breakdown of the data consumption of the selected usage type per user for the current month.
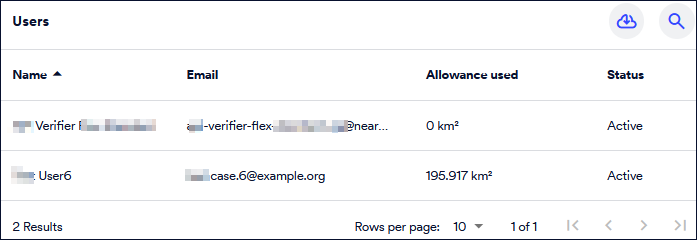
The information displayed here depends on the duration you selected for the Usage History chart.
To search usage for a specific user, click Search, and type a part of or the entire name or email address of the user you want to locate.
Downloading
You can download usage for all users for this subscription. The Download icon (next to the Search icon) will export the data for the selected duration into a .csv file.
The following information is displayed in the downloaded CSV:
first_name, last_name - User's first and last names.email - User's email address.status - Whether the user is active or not.department tiles (daily-rates) - Number of tiles in the AOI.3d_export - Usage area in square meters or square miles.tile_count - The number of tiles in the AOI returned by the API or viewed via MapBrowser. 2d_data (bytes) - Nearmap 2D data consumed by the client_type.- Other data related to number of properties, transaction credits, and so on.